
Who Belongs to Unions? A Demographic Breakdown
The stereotype is a white guy in a hard hat. It's been the default image in every stock photo, every newspaper illustration, every political ad about organized labor for decades. But the actual union statistics tell a completely different story.

Who Belongs to Unions? A Demographic Breakdown That Might Surprise You
The stereotype is a white guy in a hard hat. It's been the default image in every stock photo, every newspaper illustration, every political ad about organized labor for decades. But the actual union statistics tell a completely different story. Black workers are the most unionized demographic group in America. Women have nearly closed the membership gap with men. And some of the fastest-growing union campaigns are happening in coffee shops, hospitals, and software companies. The real face of organized labor in 2026 looks nothing like the cartoon version most people carry around in their heads.
I've spent years tracking labor data, and the disconnect between perception and reality here is one of the widest I've seen on any topic. So let's look at who actually joins unions, what the numbers reveal about the American workforce, and why this matters for everyone, whether you carry a union card or not.
14.7 Million Workers in the Current Count
According to the Bureau of Labor Statistics' 2025 report, released in February 2026, about 14.7 million wage and salary workers belonged to unions. That puts the overall union membership rate at 10.0%, continuing a long decline from a peak of 33.5% in 1954.
But raw membership numbers only tell part of the story. Union representation — which counts workers covered by a collective bargaining agreement even if they haven't formally joined — sat at 11.2%, covering about 16.5 million workers. That gap between membership and coverage means roughly 1.8 million people benefit from union-negotiated contracts without being dues-paying members.
A Gallup survey found that nine percent of workers employed full or part time say they belong to a union. And public approval of unions has hit 71% — the highest mark in over 60 years. People like unions more than ever. They're just less likely to be in one than their parents were.
Black Workers Lead Every Other Group
Here's the number that breaks the stereotype wide open. Black workers have the highest union membership rate of any racial group at 11.4%. White workers come in at 9.9%. Hispanic workers sit at 8.9%, and Asian workers at 8.7%, according to BLS data.
This isn't a new development. Black workers have consistently been the most unionized demographic group for years. And the economic impact is significant. Black union members earn roughly 13.1% more than their nonunionized counterparts. For Hispanic union members, the premium is even larger at 18.8%.
The U.S. Treasury Department has documented how unions reduce racial wage gaps by adopting explicit anti-discrimination measures, supporting anti-discrimination legislation and enforcement, and promoting wage-setting practices that are less susceptible to implicit bias. Transparent pay scales don't leave room for the kind of quiet, unspoken disparities that plague non-union workplaces.
The flip side of this data is sobering. Research shows that the long decline in unionization since the 1980s has actually contributed to widening the Black-white wage gap. When unions shrink, the workers who benefited most from collective bargaining lose the most.
The Gender Gap Has Nearly Disappeared

In 2000, the gender gap in union membership was stark. According to USAFacts, 15.2% of men and 11.4% of women belonged to unions. By 2025, that spread had narrowed dramatically: 10.4% of men and 9.6% of women.
Both numbers dropped, obviously. But the convergence matters. Women's unionization rates fell more slowly than men's, largely because women are heavily represented in the public sector, where union density remains high. Teachers, nurses, social workers, and government employees — occupations where women make up the majority of the workforce — are among the most unionized jobs in the country.
Research shows unionized women earn about 4.7% more on average than nonunionized women with similar qualifications. That's not a massive number in isolation, but compounded over a career, it translates to tens of thousands of dollars in lifetime earnings.
Younger Workers Face Structural Barriers
Union membership demographics skew older, and the numbers make it obvious why. Workers aged 45 to 54 had the highest unionization rate in 2025 at 12.6%. Workers aged 16 to 24 had the lowest at just 4.7%.
This isn't because young workers don't want unions. Polling consistently shows that workers under 35 are the most enthusiastic about organized labor. The problem is structural. Younger workers are concentrated in service-sector and gig-economy jobs where union presence is thin. They change jobs more frequently. And they often work for employers who aggressively resist organizing efforts.
But something is shifting. Tech workers organizing in Silicon Valley was barely a headline five years ago. Now it's a movement. Young employees at coffee chains, media companies, museums, and startups have filed union election petitions at rates not seen since the mid-2010s. The Service Employees International Union's Committee for Interns and Residents doubled its membership to over 37,000 by 2025 as young physicians organized to address burnout and administrative overload.
The age gap in union membership may narrow in the coming years. But it'll take sustained effort and a willingness to organize in industries where the labor movement has historically had no foothold.
Public Sector vs. Private Sector
The single biggest divide in who joins unions isn't race or gender or age. It's whether you work for the government or a private employer.
Public-sector workers had a union membership rate of 32.9% in 2025. Private-sector workers: 5.9%. That's more than a five-to-one ratio. Local government workers topped the chart at 37.8%, driven by teachers, firefighters, and police officers.
The raw numbers are nearly equal, though. About 7.3 million public-sector workers and 7.4 million private-sector workers belonged to unions. The private sector employs so many more people that even a tiny percentage translates to millions of union members.
Understanding how worker democracy functions in these different settings helps explain the gap. Public-sector employers don't face the same market pressure to crush organizing campaigns. Government jobs are harder to offshore. And public employees have had legal protections for collective bargaining in most states for decades, while private-sector workers face a legal framework that many labor scholars consider badly stacked against them.
The National Labor Relations Act protects private-sector workers' right to organize, but enforcement is slow, penalties for employer violations are minimal, and the process itself can take years. That's a big reason private-sector density has cratered.
Where the Jobs Are
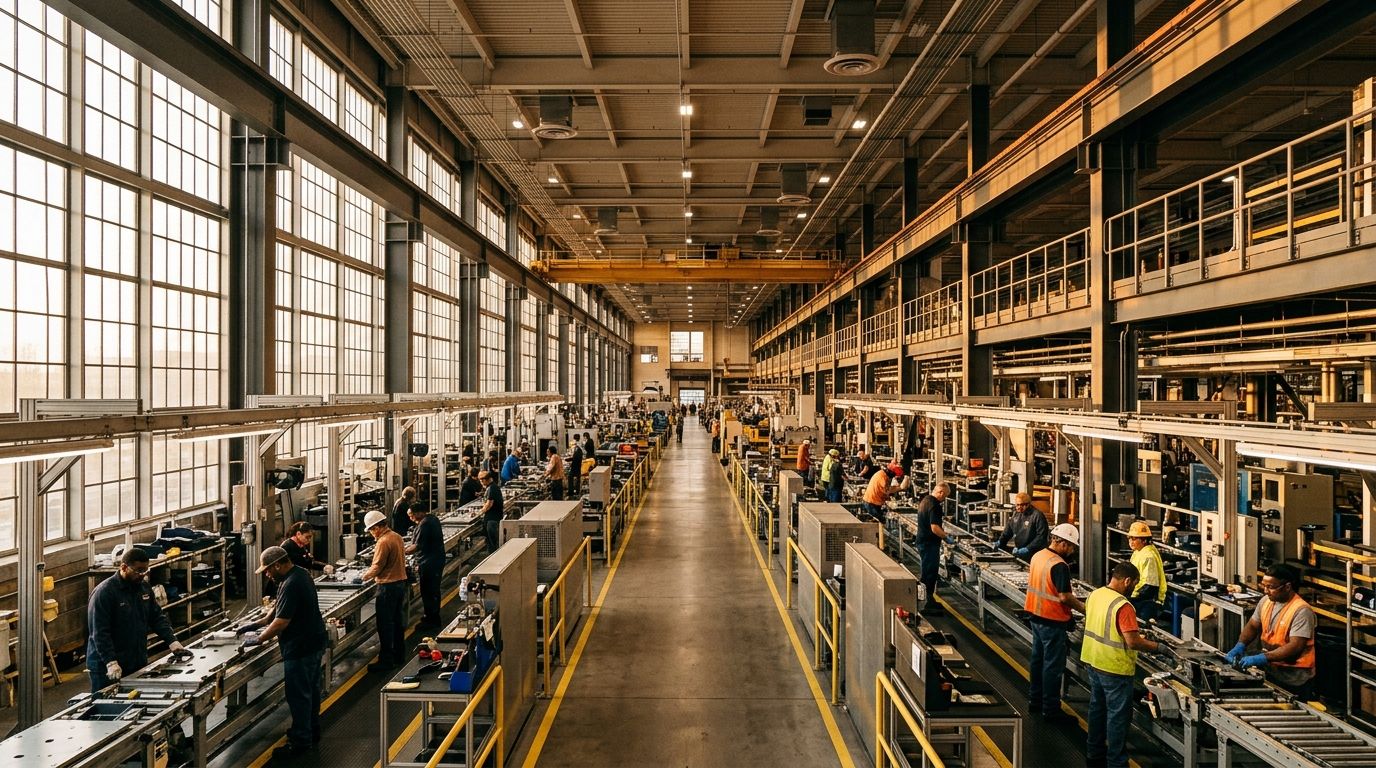
Drilling into specific industries reveals even more about union membership demographics. The most unionized industries won't surprise anyone who's been paying attention:
Utilities: Consistently one of the highest unionization rates in the private sector
Transportation and warehousing: Driven by legacy union presence and recent organizing pushes
Education and health services: The backbone of public-sector unionism
Construction: Home to some of the oldest and most established trade unions in the country
Groups like the Teamsters have been expanding organizing across supply chain industries, pushing into warehouses and logistics operations that weren't traditionally union territory. And for workers entering the trades, union apprenticeship programs remain one of the most reliable pathways to a middle-class career without a four-year degree.
The least unionized industries include professional and business services, leisure and hospitality, and agriculture. These sectors share a few common traits: high turnover, fragmented workplaces, and a workforce with less bargaining power.
State-by-State Variation
Union density varies wildly by state. Hawaii and New York consistently report the highest rates. Southern and mountain states tend to cluster at the bottom, often in single digits.
Right-to-work laws play a major role. In states where workers covered by a union contract can opt out of paying dues, union density tends to be lower. This isn't a coincidence; it's the intended effect of those laws.
Illinois saw its unionization rate rise to 13% in 2025, attributed to gains in public-sector organizing. But interpreting state-level data for 2025 requires caution. A federal government shutdown in October 2025 disrupted the Current Population Survey data collection, creating a gap in the dataset that the BLS flagged in its release.
What the Demographics Reveal About Power and Inequality
Numbers are just numbers until you connect them to real working conditions. Here's what the demographic breakdown tells us:
Unions are a significant equalizer for Black and Hispanic workers, delivering earnings premiums that outpace what white workers gain from membership
The gender gap in union membership has nearly closed, driven by women's concentration in public-sector jobs that remain heavily organized
Young workers are enthusiastic about unions but underrepresented in them — a gap that represents both a challenge and a massive opportunity
The public-private sector divide dwarfs every other demographic split and is largely a function of legal and structural barriers to private-sector organizing
The practical takeaway for anyone who cares about the future of work: if you want to understand who joins unions and why, stop looking at the old stereotypes. The data paints a picture of a labor movement that's more diverse than most people realize, with its strongest footholds among workers who face the largest earnings gaps without collective bargaining. Unions don't just negotiate wages. They compress inequality. And the workers who need that compression the most — Black workers, Hispanic workers, women, young people entering a hollowed-out economy — are exactly the ones either joining or trying to join.
The question isn't whether workers want unions. At 71% approval, that's settled. The question is whether the structures exist to let them have one.
The Union Edge Staff
Also in the paper