
Wage Benchmarking as an Organizing Tool: How to Document Pay Inequality Before Filing for Union Recognition
The Bureau of Labor Statistics publishes wage data broken down by occupation, metropolitan area, and industry across roughly 800 occupational profiles updated annually, all free to download.

Wage Benchmarking as an Organizing Tool: How to Document Pay Inequality Before Filing for Union Recognition
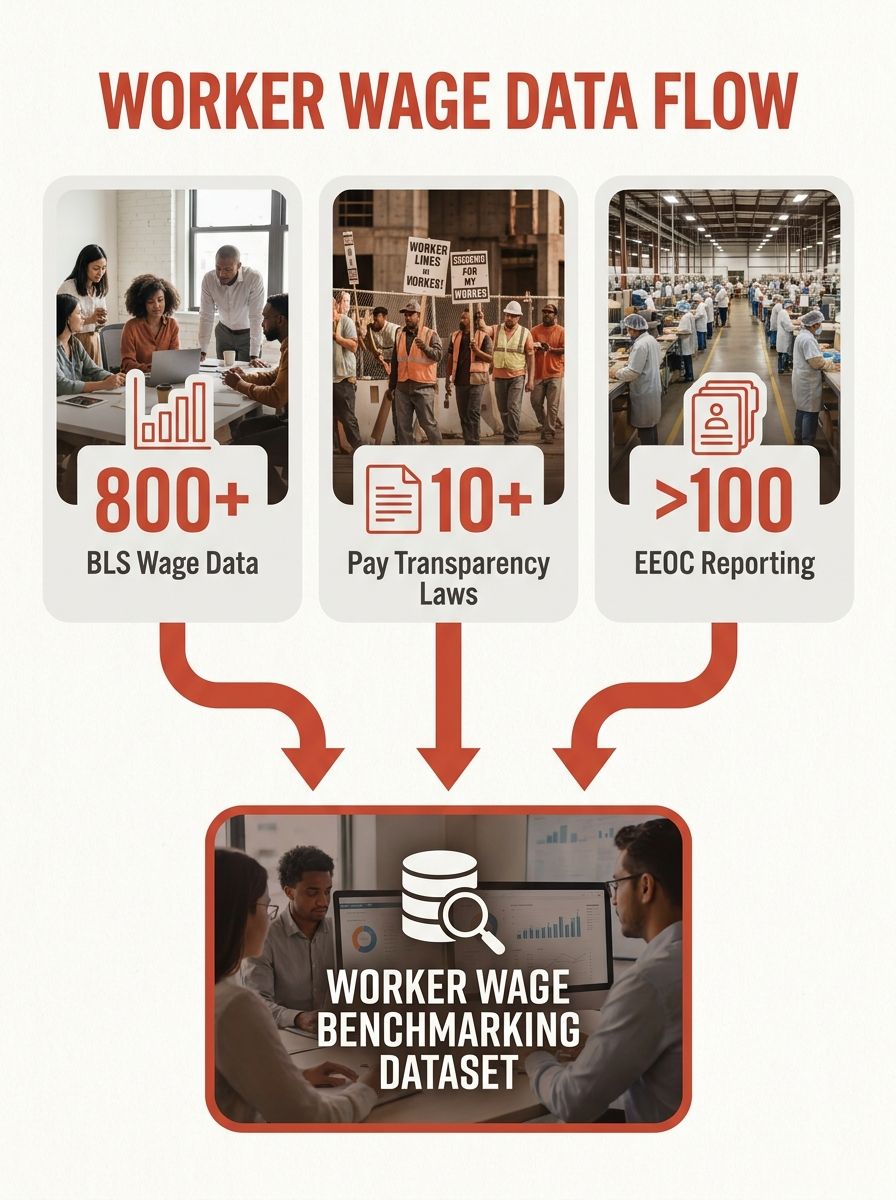
The Bureau of Labor Statistics publishes wage data broken down by occupation, metropolitan area, and industry across roughly 800 occupational profiles updated annually, all free to download. The EEOC requires private-sector employers with 100 or more employees to submit workforce demographic data through the EEO-1 Component Data Collection report. And pay transparency laws in Colorado, New York City, Washington state, and more than a dozen other jurisdictions now force employers to disclose salary ranges in job postings. Taken together, these three streams of public information have created something organizers didn't have even five years ago: a documented, verifiable foundation for proving that your employer is paying you less than the market, less than comparable workers, or less than they've publicly promised. That foundation is wage benchmarking, and used correctly, it's one of the most powerful pieces of evidence a worker committee can bring into an organizing drive.
This article walks through the process chronologically, from the earliest data gathering through the moment you present findings to your coworkers and prepare to file for recognition.
The Data Landscape That Made This Possible
Wage benchmarking for organizing purposes didn't become practical until a few key changes happened in sequence. The BLS Occupational Employment and Wage Statistics program has existed for decades, but its usefulness expanded significantly as its downloadable salary surveys began allowing users to sort by organization size, part-time versus full-time status, incentive-based versus time-based pay, work level, and job family. You can pull the median hourly wage for a medical coder in Tampa and compare it against a medical coder in Phoenix within minutes.
Then came state and municipal pay transparency mandates. Colorado's Equal Pay for Equal Work Act, effective since 2021, requires employers to include compensation ranges in every job posting. New York City followed in 2022. By 2026, roughly 25% of U.S. workers live in jurisdictions where employers must disclose salary ranges publicly. These disclosures create a paper trail that didn't exist before. When your employer posts a range of $48,000–$62,000 for a position and you can document that three people in that same role are earning $43,000, the gap speaks for itself.
The third piece is the EEOC's pay data collection authority. As the Center for American Progress has noted, pay data collection provides enforcement agencies with better data to investigate systemic discrimination. For organizers, the significance is indirect but real: the existence of these federal reporting requirements means your employer already tracks compensation data by job category, sex, and race or ethnicity. They have the spreadsheet. The question is whether you can build your own.
Collecting Internal Pay Data Without Alerting Management
This is where the organizing strategy begins. Before you can benchmark anything against external data, you need to know what your coworkers are actually earning. And this is where many campaigns stumble, because talking about pay still feels taboo in most American workplaces, even though Section 7 of the National Labor Relations Act protects your right to discuss wages with coworkers.
The most effective approach we've seen organizers use is structured, department-by-department conversations. You don't need to survey the entire workplace at once. Start with the people you trust. Ask three specific questions: What's your base hourly rate or annual salary? When was your last raise, and how much was it? Do you receive any bonuses or differential pay, and if so, what triggers them?
Keep the data organized from day one. A shared spreadsheet stored on a personal (not company) device works, but digital security matters here. Don't use company email, company Slack, or any tool your employer administers. Use a personal Google Sheet, a Signal group, or an encrypted note-taking app. Record each data point with the worker's job title, department, approximate tenure, and any demographic information they're willing to share (gender, race, age). That demographic layer is what transforms a simple salary comparison into genuine pay equity documentation.
How many data points do you need? There's no magic number, but your analysis gets meaningfully stronger once you have compensation information from at least 40–50% of the proposed bargaining unit. If you're working toward the 30% authorization card threshold, you're already having one-on-one conversations with most of your coworkers. The pay question should be part of every one of those conversations.

Building the External Benchmark
Once you have a reliable picture of internal wages, you need something to measure them against. This is the salary comparison phase, and the good news is that the tools are better and cheaper than they've ever been.
Start with the BLS. The Occupational Employment and Wage Statistics program gives you the 10th, 25th, 50th, 75th, and 90th percentile wages for hundreds of occupations, filterable by state and metropolitan statistical area. If your employer operates in a specific metro area, pull the 50th percentile wage for each job classification in your unit. That's your baseline market rate.
Then check job postings. In states with pay transparency laws, your employer's own postings may tell you the range they're willing to pay new hires. Glassdoor, Indeed, and LinkedIn also aggregate reported compensation. Cross-reference at least three sources for each classification to build a defensible range.
For unionized comparison points, look at existing collective bargaining agreements in your industry. Many local unions maintain updated rate sheets with effective dates and geographic boundaries. If there's a unionized employer doing similar work in your region, their contract wages provide the most direct evidence of what organized workers in your field actually earn. This comparison tends to resonate deeply during one-on-one conversations with coworkers.
A word of caution: external benchmarking data can sometimes reproduce historical inequities. If the BLS median for a given occupation is itself depressed by decades of gender- or race-based wage discrimination, then benchmarking to the 50th percentile may set the bar too low. Consider benchmarking to the 75th percentile for historically underpaid roles, or supplementing your salary comparison with a separate equity analysis that isolates demographic gaps.
Running the Analysis
You now have two datasets: what your coworkers earn, and what the external market says comparable workers earn. The analysis phase brings them together, and it doesn't require a statistician, though having one helps.
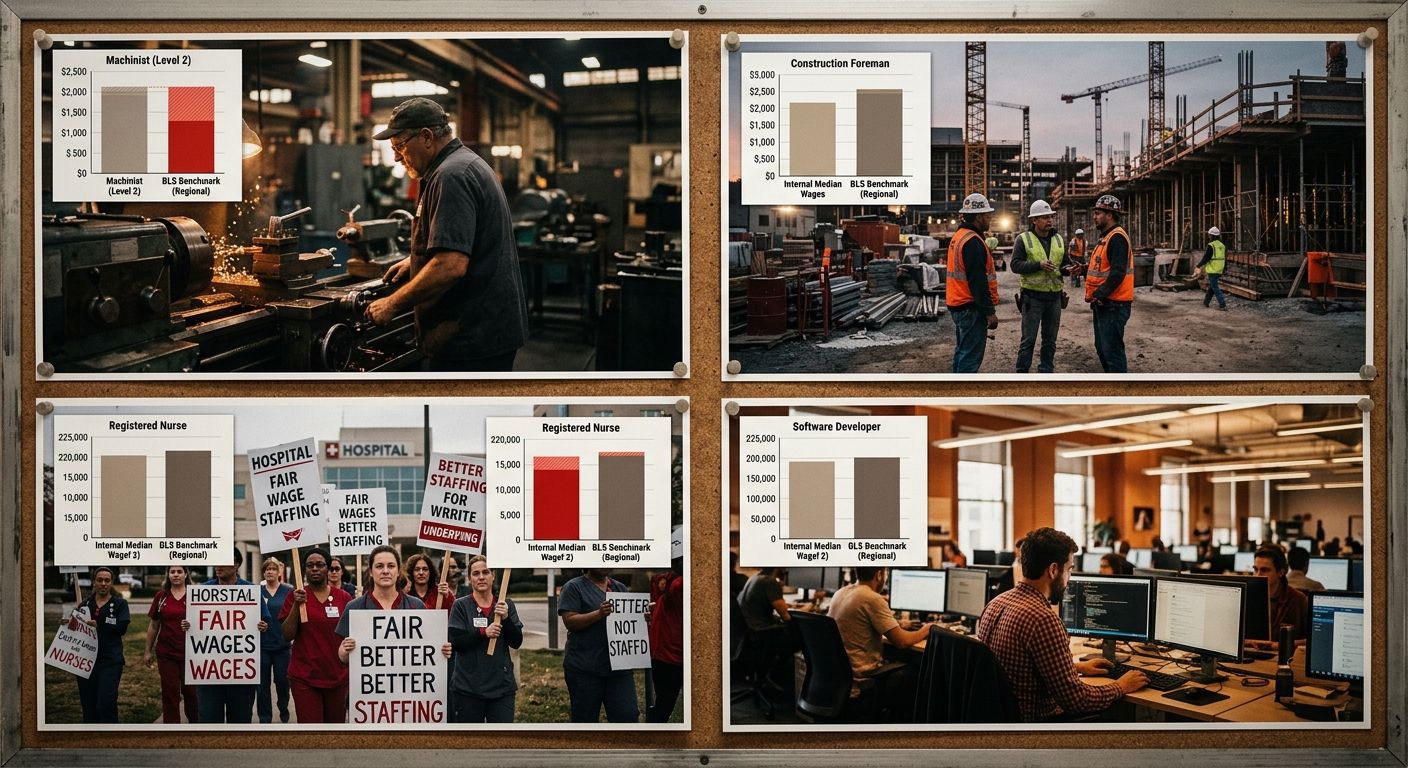
The simplest approach is a gap analysis by classification. For each job title or role in your bargaining unit, calculate the median internal wage and compare it to the external benchmark median. Express the difference as both a dollar amount and a percentage. A finding that warehouse associates at your facility earn $17.40/hour when the BLS metro median is $20.10/hour is a 13.4% gap, and that number means something concrete to every person affected by it.
Next, layer in the demographic analysis. Compare median wages by gender and by race within the same job classifications. Research from David Card at UC Berkeley has documented that wage dispersion within unionized workplaces is consistently narrower than in nonunion workplaces, a finding that holds across multiple countries. The Economic Policy Institute has shown that collective bargaining agreements standardize wage rates and promote pay transparency in ways that directly combat gender-based pay disparity. If your internal data reveals that women in the same roles earn less than men, or that Black and Latino workers are clustered at the bottom of the pay range for their classification, you've identified exactly the kind of structural inequity that unionization is built to address.
Document everything in a clear, readable format. We recommend a one-page summary per job classification: the internal median, the external benchmark, the gap percentage, and any demographic breakdowns. Keep the raw data secured separately. The summary is what you'll share; the underlying spreadsheet is what you'll protect.
Turning the Spreadsheet into an Organizing Argument
Data changes minds. The wage benchmarking findings you've assembled aren't an academic exercise. They're a persuasion tool, and how you deploy them matters as much as what they contain.
When you sit down with a coworker who's on the fence about signing an authorization card, a personalized data point lands harder than any general argument about worker power. "The market median for your exact role in this metro area is $54,200. You're making $46,500. That's a $7,700 gap, and people doing this same job at the unionized facility across town make $57,000 under their contract." That's specific. That's personal. That's difficult to argue with.
The demographic findings serve a different but equally important function. When your data shows that women in your unit earn 8% less than men in the same classification, or that workers of color are disproportionately in the lowest-paid tier, those numbers build solidarity across demographic lines. They show that the pay problem is structural, designed into the employer's compensation system, and that individual negotiation will never fix it. This connects directly to what we've written about converting workplace complaints into sustained campaigns. The complaint has to become evidence, and the evidence has to become a shared story.
Your wage benchmarking report can also serve as a foundation for your first contract demands. If the organizing drive succeeds and you reach the bargaining table, the pay equity documentation you built during the campaign becomes your opening position on wages. You're not guessing at what to ask for. You're pointing to documented market rates and measurable internal gaps. This gives your negotiating committee real numbers to work from on day one.
How Employers Respond, and How to Prepare
Management will have counterarguments. Knowing them in advance makes your data harder to dismiss.
The most common response is that total compensation includes benefits, not just wages, and that when you account for health insurance, retirement contributions, and PTO, the gap shrinks or disappears. This is sometimes true. It's worth including a benefits comparison in your analysis if you can obtain the data. But it's also worth noting that many employers have shifted to high-deductible health plans and reduced retirement matching over the past decade, so the true cost of employer-sponsored benefits may be lower than management claims.
The second response is that individual performance justifies pay differences. This is where your demographic analysis becomes critical. If men and women with the same tenure and job title show consistent pay gaps, the performance argument collapses unless the employer can produce documentation showing that all the higher-paid men happen to be higher performers. Few employers can produce that documentation, because few employers have rigorous, unbiased performance evaluation systems.
The third response is silence. Some employers simply refuse to engage with the data at all, betting that ignoring the findings will make them go away. It won't, because by the time you're presenting wage benchmarking results, you've already had dozens of one-on-one conversations, and the numbers are in workers' heads. You can't un-know that you're being paid $7,700 below market.
The State of Play
Wage benchmarking is becoming a standard part of the organizing toolkit in industries from healthcare to logistics to tech. The Google DeepMind workers who voted to unionize in London built their campaign partly on compensation transparency concerns. Pay equity legislation continues to expand at the state level, with Connecticut's 2026 labor bill addressing wage theft and pay transparency simultaneously.
The data access picture is better than it has ever been for workers. BLS surveys are free. Pay transparency laws are spreading. Salary comparison platforms have proliferated. And the research consistently shows that unionized workplaces produce narrower wage gaps across gender and racial lines. What hasn't changed is that the employer still has more information than you do. They know every salary in the building. You have to build your dataset one conversation at a time, one trusted coworker at a time, one shift break at a time.
That asymmetry is real, and it's why the documentation process we've described here takes weeks or months of patient work. But the asymmetry also contains its own motivation: the very fact that your employer won't share pay data openly is itself evidence that transparency would work against their interests. Workers who do the painstaking work of assembling their own compensation picture often find that the numbers make the case for collective bargaining more persuasively than any speech or pamphlet ever could.
The Union Edge Staff
Related Articles

LaborLab Releases Tools to Track Union-Busting Campaign Costs as Employers Evade Disclosure Law
LaborLab, a workers' rights watchdog organization, released a search tool and cost estimator on September 8 designed to expose the spending patterns of the $1.7 billion union-busting industry, according to The American Prospect.

When Employers Fight Back: Recognizing and Countering Union-Busting Tactics During Your Organizing Campaign
U.S. employers are charged with violating federal law in 41.5% of all union election campaigns, according to a study from the Economic Policy Institute. The violations follow a predictable script.

Digital Member Systems and Union Data Security: What Organizers Need to Know Before Going Digital
Every union digital organizing platform stores names, addresses, phone numbers, employer information, and authorization signatures. A breach of that data hands management a complete map of your organizing committee. These six rules protect your members and your campaign.
Also in the paper